Page 17 - Rare Earths and Rare Materials
P. 17
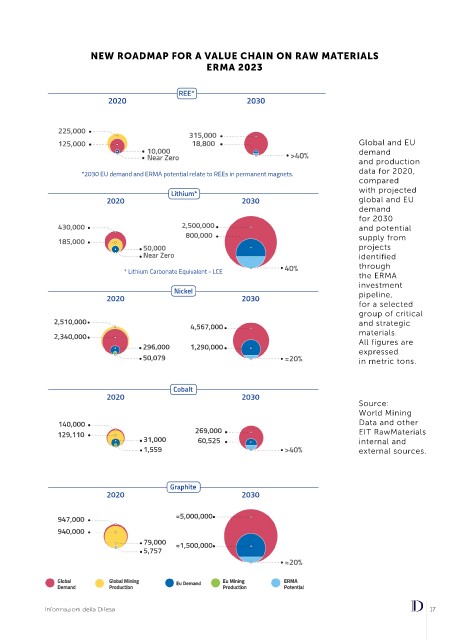
NEW ROADMAP FOR A VALUE CHAIN ON RAW MATERIALS
                                                     ERMA 2023


 Lithium*                                     REE*
 2020  2030                 2020                               2030


 430,000  2,500,000  225,000
 800,000                                         315,000
 185,000        125,000                          18,800                                     Global and EU
 50,000                               10,000                                                demand
 Near Zero                            Near Zero                           >40%              and production
 40%                                                                                        data for 2020,
 * Lithium Carbonate Equivalent - LCE  *2030 EU demand and ERMA potential relate to REEs in permanent magnets.
                                                                                            compared
                                             Silicon*
 Nickel                                     Lithium*                                        with projected                   REE*
                            2020
                                                               2030
 2020  2030                 2020                              2030                          global and EU   2020                              2030
                                                                                            demand
                                                                                            for 2030
 2,510,000     3,218,000                       2,500,000
                430,000
                                                                                               225,000
 4,567,000                                      4,000,000                                   and potential                       315,000
 2,340,000     3,090,000                        800,000                                     supply from                         18,800
                185,000
                                                                                               125,000
                                                 600,000
                                      453,000
 296,000  1,290,000                  50,000                                                 projects                 10,000                              >40%
                                     Near Zero
                                                                                                                     Near Zero
                                                                                            identified
 50,079  ≈20%                         367,000                                               through
                                * Lithium Carbonate Equivalent - LCE
                            *Total production. Data reported are for EEA member countries.  40%  the ERMA  *2030 EU demand and ERMA potential relate to REEs in permanent magnets.
                                                                                            investment
                                             Copper
 Cobalt                                      Nickel                                         pipeline,                       Silicon*
 2020  2030                 2020                              2030                          for a selected   2020                             2030
                            2020
                                                               2030
                                                                                            group of critical
              23,500,000                                                                    and strategic
                                                                                              3,218,000
               2,510,000
 140,000                                         4,567,000                                  materials.                         4,000,000
                                                                                              3,090,000
               2,340,000
 129,110  269,000  20,680,000                  25,500,000                                   All figures are                     600,000
 31,000  60,525                      296,000   3,000,000                                                             453,000
                                                 1,290,000
                                      2,758,000
 1,559  >40%                         50,079                              ≈20%               expressed                367,000
                                                                                            in metric tons.
                                      871,800                             ≈15%                             *Total production. Data reported are for EEA member countries.
                                             Cobalt                                                                         Copper
 Graphite                   2020               Zinc           2030                                          2020                              2030
 2020  2030                 2020                               2030                         Source:
                                                                                            World Mining
                                                                                              23,500,000
                140,000
 947,000  ≈5,000,000  13,278,000                  269,000                                   Data and other                    25,500,000
                                                                                              20,680,000
                                                                                            EIT RawMaterials
                129,110
 940,000      13,100,000             31,000    18,100,000                                   internal and                      3,000,000
                                                   60,525
                                                2,589,000
                                      1,900,000
 79,000  ≈1,500,000                  1,559                               >40%               external sources.        2,758,000
 5,757                                770,000                             ≈20%                                       871,800                             ≈15%
 ≈20%
                                            Graphite                                                                         Zinc
 i
 G Global  l  G Global Mining     E Eu Demand d  E Eu Mining   E ERMA A  2020  2030                         2020                              2030
 g
 M
 l
 l
 M
 b

 l
 o
 a
 R
 i
 n
 b
 n
 u

 i
 M
 g
 a
 i
 n
 o
 n
 n
 a
 m
 u
 D

 e
 t
 n
 r
 D Demand d  P Production n  P Production n  P Potential l
 u
 c
 a
 m
 i
 c
 a
 i
 n
 t
 t
 o
 r
 i
 e
 o
 o
 t
 o
 d
 u
 e
 o
 d
 Global and EU demand and production data for 2020, compared to projected global and EU demand for 2030   947,000  ≈5,000,000  13,278,000
 and potential supply from projects identified through the ERMA investment pipeline, for a select group of critical   940,000  13,100,000  18,100,000
 and strategic materials. All figures are expressed in metric tonnes.  Fonte: World Mining Data and other EIT RawMaterials internal and external sources.  1,900,000  2,589,000
                                     79,000
                                     5,757   ≈1,500,000                                                              770,000                             ≈20%
                                                                         ≈20%
                                                             n
                                                             i
                                                                          M
                                                                          R
                                                            n

                                                          u
                                                            i
                                                           M
                                M
                 b

                G Global  l  G Global Mining     E Eu Demand d  E Eu Mining  g  E ERMA A
                l
                 o
                               a
                              b
                              o
                  a
                                l
                             l
                                  i
                                  n
                                   g
                                   n
                                 i
                                               D
                                                e
                                              u

                                                 m
                                                  a
                                                  n
                e
                                                                             i
                                                                            t
                                                                           e
                                                                           n
                   n
                D Demand d   P Production n              P Production n  P Potential l
                  a
                 m
                                                                             a
                             r
                                                           d
                                t
                                c
                                                            u
                                 i
                                 o
                                                           o
                                                          r
                                                             c
                              o
                              d
                                                                          t
                                                                          o
                               u
                                                             t
                                                              o
                                                              i
             Global and EU demand and production data for 2020, compared to projected global and EU demand for 2030
            Informazioni della Difesa                                                                         17
             and potential supply from projects identified through the ERMA investment pipeline, for a select group of critical
             and strategic materials. All figures are expressed in metric tonnes.                Fonte: World Mining Data and other EIT RawMaterials internal and external sources.
   12   13   14   15   16   17   18   19   20   21   22